Candlestick
Candlestick charts are designed to visualize a change in value over an interval of time, and as such are excellent at showing price movements in stocks, currency values, or securities such as bonds. While a single candlestick can display the changes over one time interval, several can be placed side by side to show a trend over a longer time period, or to provide comparisons.
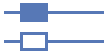
A candlestick chart displays an opening, closing, highest, and lowest price value for a time interval. The chart consists of a box with two lines, known as wicks, that extend out of either end of it. The wicks extend to the highest and lowest values reached during the interval. The edges of the box are defined by the opening and closing values. If the closing value is less than the opening value then the box is shaded and filled in with the color selected to display loss. If the closing value is greater than the opening value than the box remains unshaded, or is optionally filled in with an alternate color selected to display gain.
The MicroCandlestickChart control accepts values for the opening, closing, high, and low values. The control will determine if there is a gain or loss based on the opening and closing values and display the parts using the appropriate style. Note that if the high value is equal to either the opening or closing values, the upper wick will not be displayed; similarly the lower wick will not be displayed if the low value is equal to either the opening or closing values. An example of giving the parts values is shown below.
<microcharts:MicroCandlestickChart HighValue="60" LowValue="5" OpenValue="15" CloseValue="33" />
Graph Minimum and Maximum
The minimum and maximum of the chart are auto-calculated if they are not given a value. The minimum and maximum are set to the smallest and largest displayed values respectively. The minimum and maximum can also be set to specific values, note that any data values outside of the set range will be clipped and not displayed.
Setting the minimum and maximum chart values can be useful for putting group of candlestick charts into the same context. This allows all the charts to display the same range and makes it easy to compare several data sets. The charts could then be rendered vertically and placed in a row to produce a comprehensive report.
Orientation
The MicroCandlestickChart.Orientation property is Horizontal by default, but can be set to Vertical as well. Setting the chart's orientation to vertical effectively rotates the control 90 degrees counter-clockwise, so the minimum value is on the bottom and the maximum is at the top of the control.
Appearance Customization
The MicroCandlestickChart control has a GainStyle and LossStyle property that can be customized to alter the appearance of the chart. Note that both styles should be set for a Shape. The control uses the gain style if the closing value is greater than the opening value and the loss style if the closing value is less than the opening value. The selected style is applied wicks and the box of the control, the stroke defining the color of the wicks and box outline and the fill defining the color inside the box. If GainStyle is not given a value then LossStyle will be used with the fill being set to Transparent instead. By default the stroke and fill of the loss style are black and the gain style is not given a value.
<microcharts:MicroCandlestickChart ... >
      <microcharts:MicroCandlestickChart.LossStyle>
             <Style TargetType="Shape">
                    <Setter Property="Stroke" Value="#5778B6" />
                    <Setter Property="Fill" Value="#5778B6" />
                    <Setter Property="StrokeThickness" Value="3" />
             </Style>
      </microcharts:MicroCandlestickChart.LossStyle>
</microcharts:MicroCandlestickChart>
The above example shows how to set a style for the chart and the appearance of a gain and loss situation.
Tool Tips
MicroCandlestickCharts support tooltips that can be custom formatted and can display the low, high, open, and close values.
| Format Parameter | Description |
|---|---|
| {0} | The low value. |
| {1} | The high value. |
| {2} | The open value. |
| {3} | The close value. |
This example displays the upper and lower quartile values as well as the mean value of the data. Note how numeric formatting is used on the values.
<microcharts:MicroCandlestickChart ... LegendStringFormat "Low: {0:C2}; High: {1:C2}; Open: {2:C2}; Close: {3:C2}" />