Bar
A bar chart displays rectangular bars with lengths proportional to the values they represent.
Baseline Value
The bar series will pivot it's bars based on the chart's baseline value, as specified by the Baseline property on XYDateTimeAxis, XYDoubleAxis, or XYDecimalAxis.
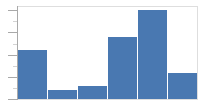
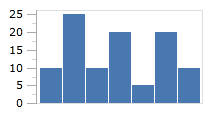
In the following example, the data rendered by the chart uses the index postion along the X-axis and the fixed values 10, 25, 10, 20, 5, 20, 10 for the Y-axis. The first image shows the series using 5 as the minimum value along the Y-axis, and 25 for the maximum. Since our baseline is 0 (the default), the bars are not pivoted.
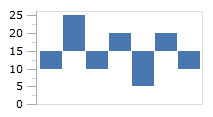
If we explicitly set our baseline value to 15, then any values below the baseline will be considered "negative" and the bars will appear to "grow" down instead of up.
Orientation
The bar chart can be oriented horizontally (the default) or vertically by setting the Orientation property. When switching orientation, the values of the XPath and YPath properties may need to be swapped.
Bar Spacing
The BarSpacing property can be used to configure the space between the bars. The default value is 1px, which indicates there should be a 1 pixel space between the bars.