Customizing Appearance
Several properties allow you to change the colors used for the pie slices, along with other elements in pie charts.
Built-In Palettes
Style selectors determine what style will be applied to each pie slice. To change the style selector, set PieSeries.SliceStyleSelector to an instance of PieSlicePaletteStyleSelector, or a custom implementation of IPieSliceStyleSelector.
PieSlicePaletteStyleSelector contains several built-in palettes to make styling your pie chart or donut chart easier. The full list can be found in the PaletteKind enumeration.
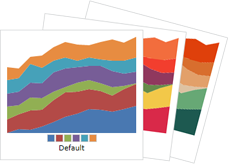
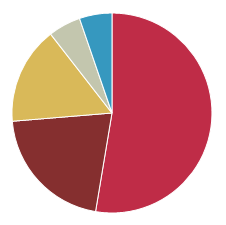
A built-in palette can be assigned to a pie / donut chart like this (in this case the Roman palette):
<charts:PieChart>
	<charts:PieSeries>
		<charts:PieSeries.SliceStyleSelector>
			<charts:PieSlicePaletteStyleSelector>
				<charts:Palette Kind="Roman"/>
			</charts:PieSlicePaletteStyleSelector>
		</charts:PieSeries.SliceStyleSelector>
	</charts:PieSeries>
</charts:PieChart>
Custom Palettes
Custom palettes can be assigned by specifying your own colors on an instance of Palette.
<charts:PieChart>
	<charts:PieSeries>
		<charts:PieSeries.SliceStyleSelector>
			<charts:PieSlicePaletteStyleSelector>
				<charts:Palette>
					<Color>#FFFF00</Color>
					<Color>#00FFFF</Color>
					<Color>#FF00FF</Color>
					<Color>#00FF00</Color>
					<Color>#FF0000</Color>
					<Color>#0000FF</Color>
				</charts:Palette>
			</charts:PieSlicePaletteStyleSelector>
		</charts:PieSeries.SliceStyleSelector>
	</charts:PieSeries>
</charts:PieChart>
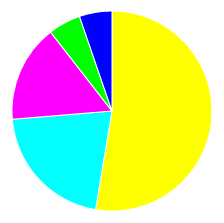
Chart Border
The color and thickness of a pie / donut chart border can be changed using the PieChart.BorderBrush and PieChart.BorderThickness properties, respectively.
<charts:PieChart BorderBrush="DarkSlateGray" BorderThickness="3"/>
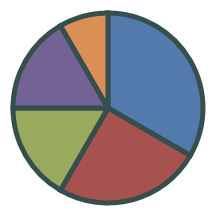
Chart Background
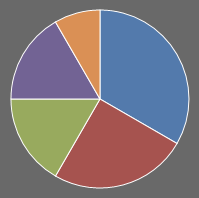
The color of a pie / donut chart background can be changed using the PieChart.Background property.
<charts:PieChart Background="DimGray"/>