Area
An area chart is a derivative of a line chart where the area between the line and axis is filled in.

Baseline Value
The area series will pivot it's polygon based on the chart's baseline value, as specified by the Baseline property on XYDateTimeAxis, XYDoubleAxis, or XYDecimalAxis The default baseline for numeric values is 0, and for date/time values it is DateTime.MinValue.
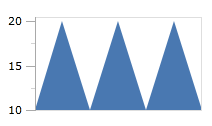
In the following examples, the data rendered by the chart uses the index position along the X-axis and the fixed values 10, 20, 10, 20, 10, 20, 10 for the Y-axis. The first image shows the series using 10 as the minimum value along the Y-axis, and 20 for the maximum. Since our baseline is 0 (the default), the polygon is not pivoted.
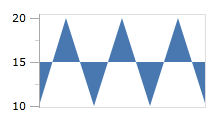
If we explicitly set our baseline value to 15, then any values below the baseline will be considered "negative" and the polygon will appear to pivot around the baseline.
Line Kind
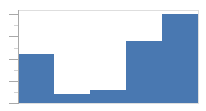
The area series supports three kinds of lines specified by the LineKind, which also determines how the area is rendered. By default, the Normal kind of line is used which simply draws a line to connect the data points when determining the area's polygon.
An area series using a normal line kind
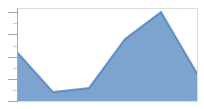
The Spline line kind builds a canonical spline that runs through the data points, producing a smooth line.
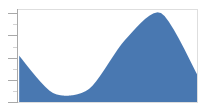
An area series using a spline line kind
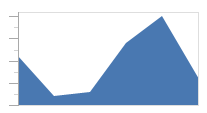
The Step line kind creates a polygon that only uses horizontal and vertical lines to connect the data points, producing a step look.
An area series using a step line kind
Line
The area series can render an actual line along the top of the area to distinguish it better. By default, the line is not rendered, but it can be shown by setting LineVisibility to a value other than None. The area series has the same configuration properties available as the line series, with regards to line rendering.
An area series with LineVisibility set to All
See the Line topic for more information on the options available.
Markers
The area series can render a marker at each data point to highlight the actual location. By default, the markers are not rendered, but they can be shown by setting MarkerVisibility to a value other than None. The area series has the same configuration properties available as the scatter series, with regards to marker rendering.
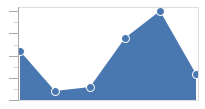
An area series with MarkerVisibility set to All
See the Scatter topic for more information on the options available.