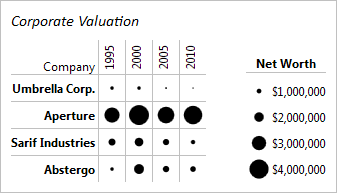
In the previous Heat Maps post, we talked about the new MicroHeatMapPresenter control's size changing abilities. In today's post, we'll look at how the color and size changing abilities can be combined to display two sets of data in the same heat map.
Color and Size-Based Heat Maps
MicroHeatMapPresenter controls can change both color and size at the same time to display two different data values with each marker. The sizing and color changing behaviors function independently, so they can represent two completely separate data sets.
In the example above, fifteen separate MicroHeatMapPresenter controls have been customized to render as circles and change size and color in order to display both the number of items sold, and the profit per item for three products in five cities.
The color and size of each control is calculated based on the position of their given color and size values in the range of color and size data respectively. Note that the tooltip displayed can be customized to display the formatted color and size values, minimums, and maximums.
Summary
Combining the color and size changing behavior of the MicroHeatMapPresenter control allows you to combine multiple instances into an engaging heat map. A heat map using color and size changing markers displays a lot of data while still being easy to understand and feeling intuitive. The MicroHeatMapPresenter control allows for the customization of the color gradient to choose from, the maximum size to render at, the shape to render, and the tooltip to display. These many options allow for the creation of unique and effective heat maps that are excellent at displaying many kinds of data.
Heat maps are now available as of the latest WPF and Silverlight maintenance releases. Download an evaluation and try them out!


