In the previous post for our Micro Charts product (currently available for WPF, Silverlight, and WinRT XAML), we introduced the new MicroBoxPlot control. In today's post, we'll look at the minimum and maximum functionality of the control.
Minimum and Maximum Display
The minimum and maximum of the chart are auto-calculated if they are not given a value. The minimum and maximum are set to the smallest and largest displayed values respectively.
If outliers are not displayed than the whisker values will be the minimum and maximum values. If outliers are displayed, then the minimum and maximum of the values given will be the minimum and maximum of the display. Alternatively, the minimum and maximum can also be set to specific values.
Use in Dashboards and Reports
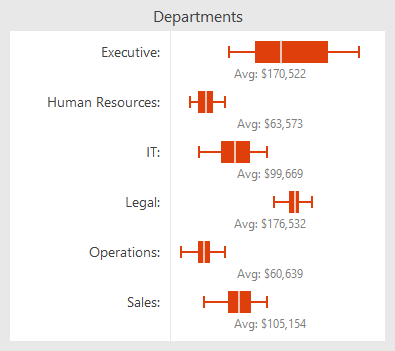
As shown below, setting the minimum and maximum chart values can be useful for putting group of box plots into the same context.
This allows all the charts to display the same range and makes it easy to compare several data sets. The box plots can then be placed directly above each other, or side-by-side to produce a comprehensive, easy-to-read report.
Summary
The MicroBoxPlot control is currently available in the Micro Charts product, which ships in our WPF, Silverlight, and WinRT XAML control sets.
In our next post in this series, we'll take a look at the chart's appearance customization options.


