Bullet Graphs Part 2 - Appearance Customization

by Avatar Bill Henning (Actipro)
Tuesday, September 4, 2012 at 10:25am

BlogPostBanner

In the previous post for our Micro Charts product (currently available for WPF, Silverlight, and WinRT XAML), we revealed the MicroBulletGraph control that is coming to Micro Charts' 2012.2 version (already available for WinRT XAML). In today's post, we'll talk about how you can customize the appearance of the MicroBulletGraph to create visually stimulating graphs.

UPDATE:  Version 2012.2 is live and available for download now.

Customization Options

There are many ways to customize the look of a MicroBulletGraph, including customizable color schemes, changing part sizes, and graph orientation. The color of the graph can be set with a single base color that applies to all the parts to quickly create a unified color scheme, or the brush on each part can be set to create custom color schemes. A combination of the methods can also be used to efficiently create a graph that has a base color with highlighted parts.

BulletGraph

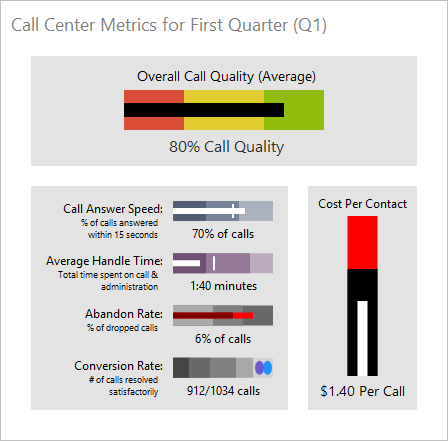
Various examples of MicroBulletGraph appearance customizations, from the upcoming WPF demo

In addition to a different color, the featured bar, comparative bar, and projected bar can also be set to a different size. The height of bars can be set to a specific number of pixels, or to a percentage of the graph to fill. The width of the comparative bar can also be set to a different number of pixels to alter how large of a range it covers.

MicroChartsCallCenter

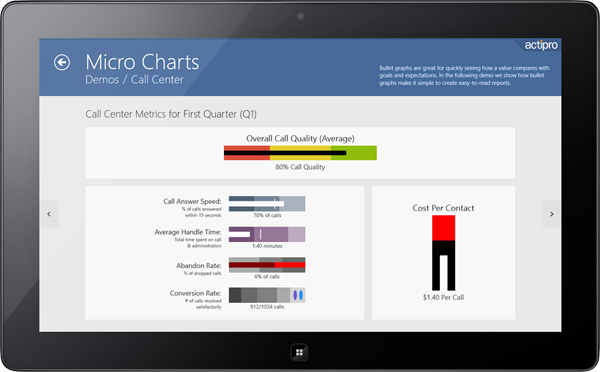
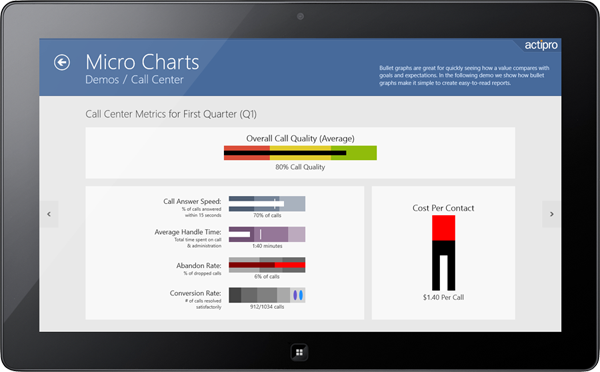
The same bullet graph demo as above, displayed in our Windows 8 WinRT XAML controls demo - available now!

Summary

The many customization options provided by the MicroBulletGraph control allow for virtually unlimited opportunities to create a unique and engaging graph. Using the appearance customization abilities graphs can be color-coded and highlight key data points while being visually appealing and easy to understand.

In our final post of this series, we'll look at some other features of the control.

TaskDownload TaskLiveDemo TaskBuyNow

Bullet Graphs Part 1 - Introduction

by Avatar Bill Henning (Actipro) - 1 comment
Thursday, August 30, 2012 at 10:42pm

BlogPostBanner

In the previous post for our Micro Charts product (currently available for WPF, Silverlight, and WinRT XAML), we finished looking at our heat map control that is able to generate heat map markers that change both in size and color.  This allows for representations of two distinct data sets in the same heat map.

In today's post, we'll take a look at a new control called MicroBulletGraph coming to Micro Charts in the WPF and Silverlight controls in their 2012.2 versions.  This control is already available in the WinRT XAML 2012.2 version of Micro Charts.

UPDATE:  Version 2012.2 is live and available for download now.

What Are Bullet Graphs?

Bullet graphs were originally designed to replace meters and gauges in a more compact way while still being informative.  They are best suited to display a value that has other related values to be compared to, such as last year's mark, a goal or target, or a projected future value.  With the MicroBulletGraph's many parts, it is easy to provide contextual information about the data being displayed.

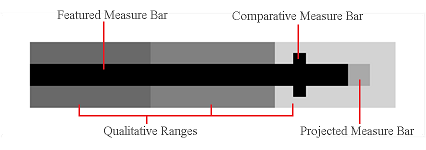
The actual value is represented by a featured measure bar, which is juxtaposed with a comparative value displayed as a bar perpendicular to it. The featured and comparative values are then placed in the context of specific ranges such as poor, average, and excellent. To give further meaning a projected bar can be used to display a future expected value of the featured bar.

BulletDiagram

In the example above all the parts of the MicroBulletGraph are displayed and labeled. Note that the only required value is the featured value, all others can be omitted, hiding the bar from view. An unlimited number of ranges can be used, or none at all, but bullet graphs most commonly utilize three qualitative ranges.

Summary

Bullet graphs are incredible tools to help the viewer grasp multiple points of information quickly without seeming cluttered or confusing.

In our next post of this series, we'll take a look at appearance customization features.

TaskDownload TaskLiveDemo TaskBuyNow

WinRT XAML Controls for Windows 8 Released

by Avatar Bill Henning (Actipro)
Thursday, August 23, 2012 at 8:18am

BlogPostBanner

Yesterday we officially released our first WinRT XAML user interface controls!  These controls are designed to be used in any .NET-based Windows 8 app and are fully compatible with both the Windows 8 and Visual Studio 2012 RTM versions.

This first 2012.2 version includes all of the Micro Charts functionality found in the WPF and Silverlight versions, along with several new micro chart controls that we'll get into soon in upcoming blog posts.

These controls are full production-quality and are not a beta product.  We are excited to be one of the very first control vendors to release Windows 8 XAML UI controls for C# and VB developers.

Diving In - Windows 8 Sample Browser

The download for our WinRT XAML controls includes detailed product documentation and C#/VB Sample Browser app projects that show many sample usage scenarios for the controls.

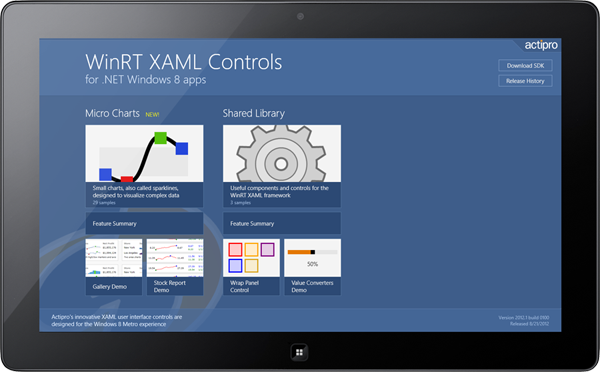
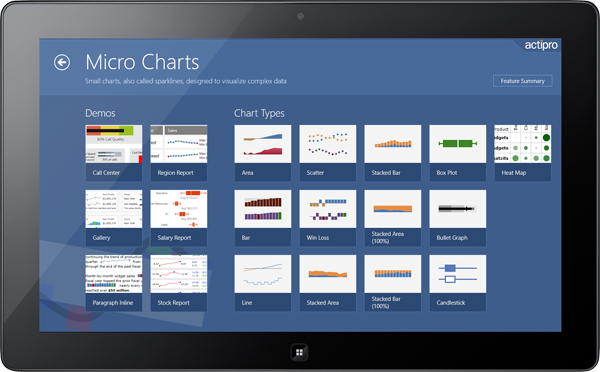
When you first load our Windows 8 Sample Browser app, you'll be presented with a fluid Metro-style user interface for navigating to the many demos and samples we provide. 

SampleBrowserRoot

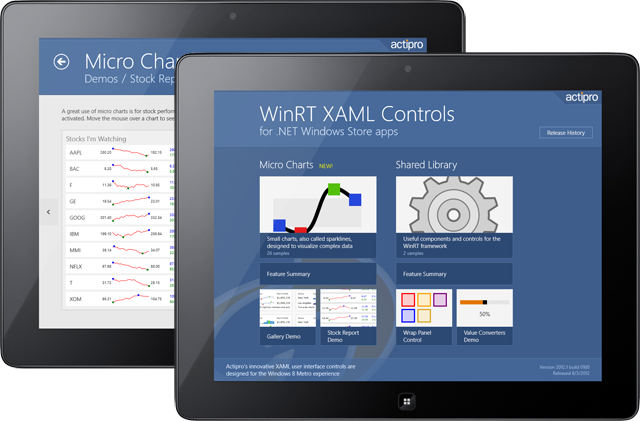
The root page lists each product in its own group and quick access to several featured demos.  Clicking or tapping on the large logo item for each product dives down into a detail page for the product.

MicroChartsSamples

This page contains categorized lists of samples and access to the product's feature summary.  Click or tap any sample item to open it.

CallCEnter

Arrow buttons on the left and right can be used to quickly navigate between samples.  You can see in this screenshot, one of our new micro charts controls (bullet graph - also coming to WPF/Silverlight in their 2012.2 versions) in action!

With this release of our WinRT XAML control products, we now have a very solid framework and samples infrastructure.  This will enable us to continue to expand our control offerings for this platform in the future.

Send Us Your Comments

After you get a chance to download our WinRT XAML controls and try out the sample, please contact us with your comments.  We'd love to hear what you think!

TaskDownload TaskBuyNow

Windows 8 Micro Charts Coming Soon

by Avatar Bill Henning (Actipro)
Monday, August 6, 2012 at 1:43pm

BlogPostBanner

We have been working hard on finishing up our first Windows 8 UI control offerings, which will focus on our Micro Charts product.  Our upcoming WinRT XAML controls have been designed to be used with Visual Studio 2012 and fit perfectly into any .NET-based Windows 8 Metro style app.

WinRT

Samples, Designer, and Documentation

We have full C# and VB sample projects ready to go that show off all the features of the WinRT XAML controls.  Visual Studio 2012 designer integration and complete API and usage documentation is included as well.

Micro Charts Product

Micro Charts is a set of charts that visualize quantitative data and are designed to render clearly in compact spaces, with common usage scenarios being within dashboards, reports, and grids.

Many chart types are supported, from basic line and bar charts to stacked area charts. The chart control includes numerous useful features such as multiple series, stacking, hot tracking, customizable palettes, and data aggregation.  Additional micro chart types such as heat maps and other unannounced new additions are included as well.

Overall, the WinRT XAML version of the Micro Charts product has the same feature set as our WPF Micro Charts product so be sure to check out that product's web site for more details on what features will be in this product.

Timeframe and Beta Testing

We are putting the finishing touches on the product at this time, and hope to publicly launch it in the next several weeks.

In the meantime, we are looking for some beta testers to help try out the controls and give us feedback on the installation process, run-time product usage, and our samples app design.  If you are someone who is seriously looking to use micro charts in your Windows 8 apps, please contact us at our sales address for more information.

UPDATE:  Our WinRT XAML Controls are live now.  Please download an evaluation!

Heat Maps Part 3 - Combining Effects

by Avatar Bill Henning (Actipro)
Thursday, July 26, 2012 at 10:35am

BlogPostBanner

In the previous Heat Maps post, we talked about the new MicroHeatMapPresenter control's size changing abilities. In today's post, we'll look at how the color and size changing abilities can be combined to display two sets of data in the same heat map.

Color and Size-Based Heat Maps

MicroHeatMapPresenter controls can change both color and size at the same time to display two different data values with each marker.  The sizing and color changing behaviors function independently, so they can represent two completely separate data sets.

MicroHeatMap

In the example above, fifteen separate MicroHeatMapPresenter controls have been customized to render as circles and change size and color in order to display both the number of items sold, and the profit per item for three products in five cities. 

The color and size of each control is calculated based on the position of their given color and size values in the range of color and size data respectively.  Note that the tooltip displayed can be customized to display the formatted color and size values, minimums, and maximums.

Summary

Combining the color and size changing behavior of the MicroHeatMapPresenter control allows you to combine multiple instances into an engaging heat map.  A heat map using color and size changing markers displays a lot of data while still being easy to understand and feeling intuitive.  The MicroHeatMapPresenter control allows for the customization of the color gradient to choose from, the maximum size to render at, the shape to render, and the tooltip to display.  These many options allow for the creation of unique and effective heat maps that are excellent at displaying many kinds of data.

Heat maps are now available as of the latest WPF and Silverlight maintenance releases.  Download an evaluation and try them out!

TaskDownload TaskLiveDemo TaskBuyNow