The recent 2013.1 versions of our WPF, Silverlight, and WinRT XAML controls added full-size charts products.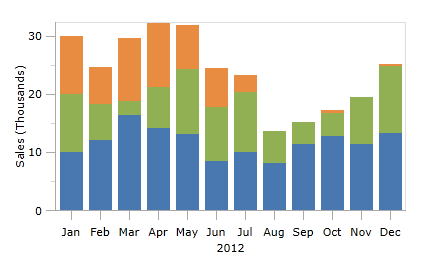
One feature of our new Charts products are axes. Axes allow you to visualize the value range of your chart by labeling values.
Minimum and Maximum Values
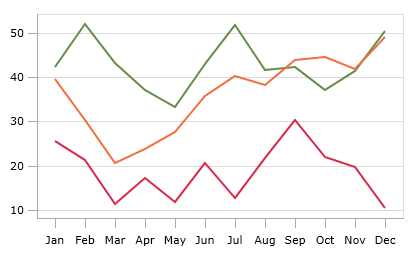
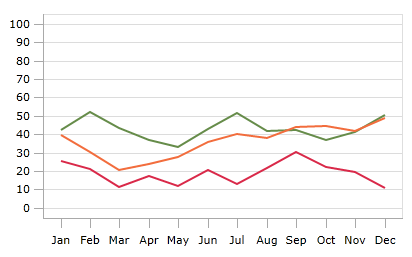
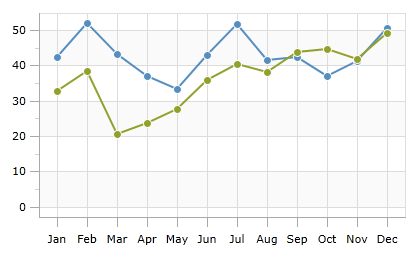
Changing axis values such as Minimum and Maximum will determine what data displays on your chart and where. Here is the same data displayed in two charts. In the first, Minimum and Maximum are determined automatically.
In the second one, they are set manually to arbitrary values.
Axis Positioning
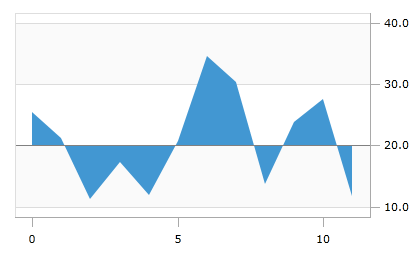
We have several capabilities to help you achieve the right look and feel for your application. The first is axis positioning, where you can place axes on either end of the chart.
Tick Intervals
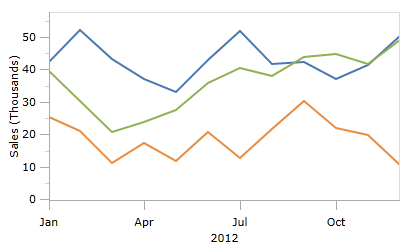
Next is the ability to set the tick intervals. Here, we see two of the same chart. In the first, tick intervals are set to one month.
In the second, tick intervals are set to three months.Grid
You can show major and minor ticks, and our grid feature allows you to extend those ticks behind the chart surface.
Styling Ticks
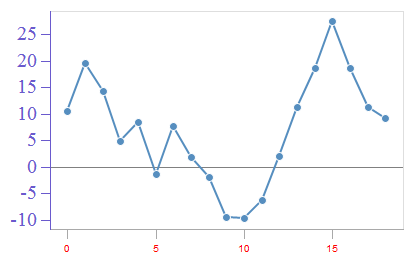
You can also style ticks to match your application.
Axis Labels
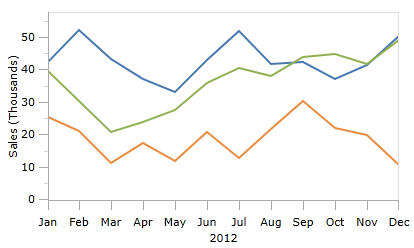
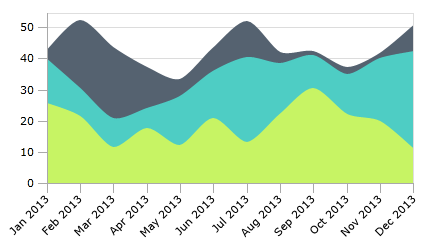
Axes can show labels on each major tick, and also a title. The angle of the labels is adjustable for when you need to put long labels on a small chart.
Summary
These are just a sample of some of the options available. There are a ton more. Download the trial and check it out!

