Actipro WPF Controls 2013.2 have been released and is now available for download.
Major new features are described below. See the announcement post for the detailed list of enhancements and updates.
PieChart
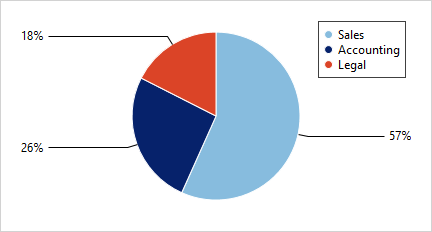
A new pie chart control has been added to complement our other bar, line, area, and scatter chart offerings.
The pie chart supports advanced features like multiple label positioning and display options, legend display, nesting of multiple series, hierarchical data, and more.
DonutChart
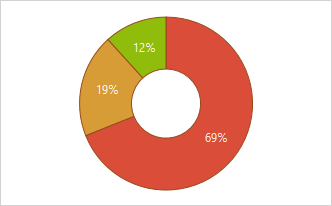
Donut charts have been added as well. All the same features found in pie charts are found in donut charts, and the hole radius is fully configurable.
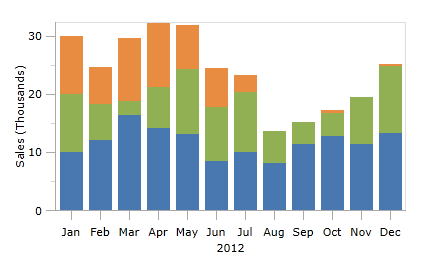
Axis Tick Labels for Percentage Stacked Charts
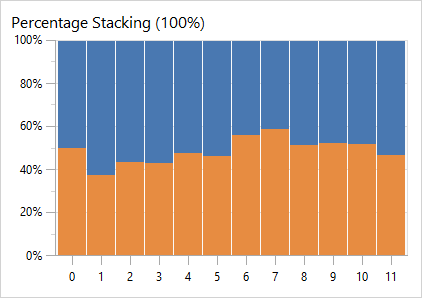
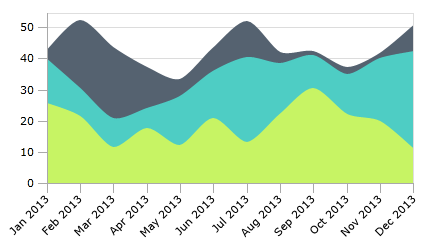
When using stacking bar or area charts with the percentage axis option, the percentage value labels now display on the axis.
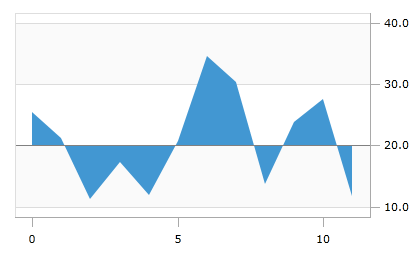
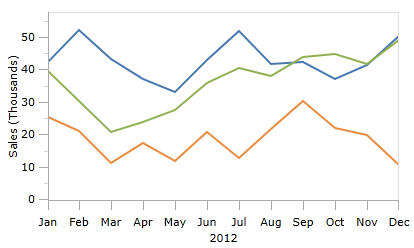
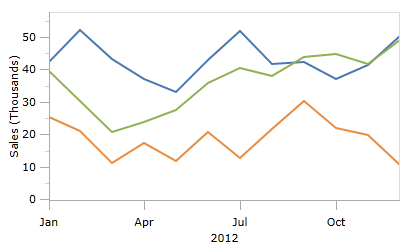
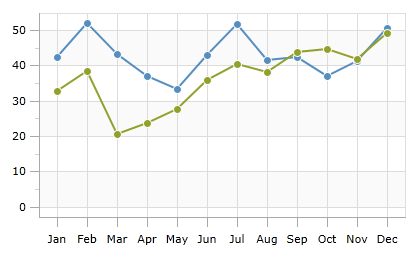
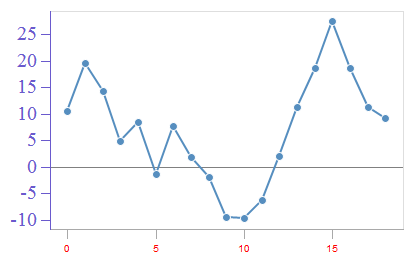
Improved Scatter Chart Samples
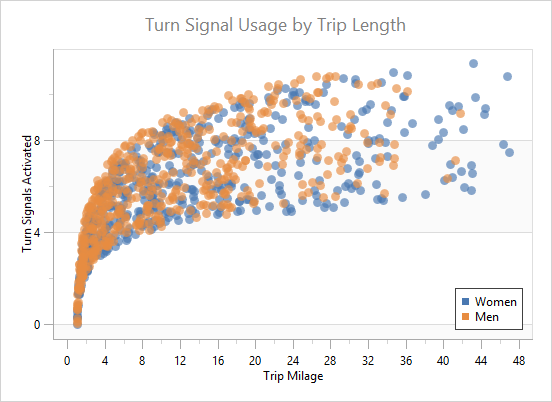
A new and improved scatter sample has been added.
Improved Support for Touch
Ribbon buttons have been improved to support touch-based tapping. Popups on all ribbon controls have also been updated to be positioned properly on tablet PCs that have the "right handed" option set.
Web Languages Add-on - Advanced JavaScript Language Implementation
A new advanced JavaScript language implementation has been added to the Web Languages Add-on.
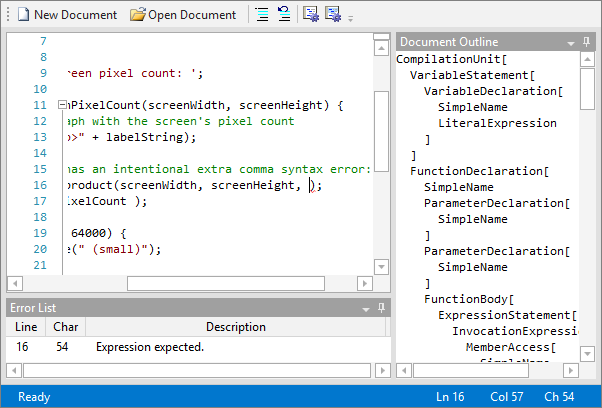
The syntax language features syntax highlighting, parsing, AST building, syntax error reporting, code outlining, delimiter auto-complete, smart indent, text formatting, and code block selection.
See a summary of the new language in this previous blog post.
Delimiter Auto-Completion
Delimiter auto-complete is where the user types a start delimiter and a related end delimiter is auto-inserted after the caret.
In the screenshot above, the { character was typed and the } character was auto-inserted. This feature has been added to several of the languages in our add-ons.
Delimiter Indent Provider
Curly brace auto-indent can now be easily added to any language, and it has been added to our C# and JavaScript languages in the add-ons.
When the caret is in the middle of a curly brace pair, pressing Enter normally will move the close curly brace to the next line with the caret right in front of it. If you have an indent provider for your language, the close curly brace will be indented properly however it's still not an ideal situation because you generally want the caret to be on its own line before the close curly brace's line.
This scenario is where curly brace auto-indent comes in! This feature injects a new blank line in between the braces, indents one more level, and positions the caret on that line.
Indentation Guides
Indentation guides are subtle vertical lines that render at each tab stop on lines prior to the first non-whitespace character. They help visually align the indentation of visible code blocks.
You can see the silver indentation guide lines in the tab stops within this screenshot:
Whitespace-only lines are intelligent and render indentation guides based on the tab stop level of surrounding text.
Improved Code Fragments Performance
Lexer and token scanning performance has been improved when using our code fragments feature, which allows you to set header and footer text to surround the document's text for purposes of parsing.
Improved Printing Support
A custom highlighting style registry can now be set explicitly for printouts. This is ideal if your editor is in a dark theme since then you can use an alternate highlighting style registry designed for light backgrounds on printouts.
Rendering of printouts has also been improved when the syntax highlighting option is off.
.NET Languages Add-on - IntelliPrompt Parameter Info for Array Indexers
Automated parameter info support has been added when the end user edits array indexers.
.NET Languages Add-on - Customizing Completion Items Sample
A new sample is now included that shows how to add and remove items from the C# and VB automated IntelliPrompt completion list. This ability lets you filter out certain completion list items or add your own custom ones before the list is displayed to the end user.
Improved WindowChrome to Not Cover Auto-Hidden Windows Taskbar
In the past versions, WindowChrome (and thus RibbonWindow) would cover up an auto-hidden Windows taskbar when the window was maximized. This issue has now been resolved, and the auto-hidden taskbar is now visible.
InertiaScrollViewer
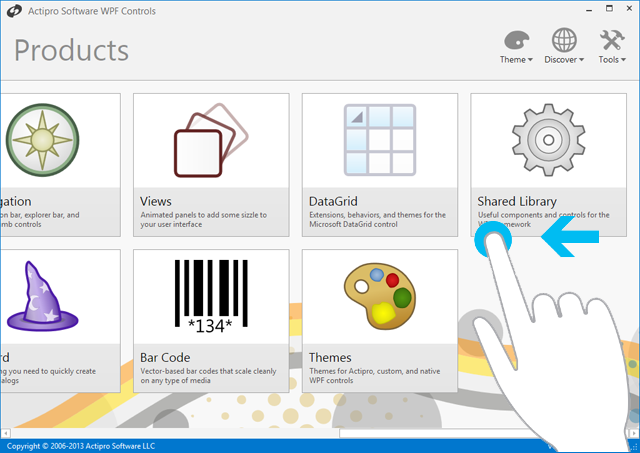
The InertiaScrollViewer control is a drop-in replacement for the native WPF/Silverlight ScrollViewer control but allows you to scroll content using touch, similar to what you're used to on Windows 8 and mobile devices.
It reacts to dragging, flicking, mouse wheel, and normal mouse operation via the scrollbars. You can adjust properties like EasingFunction, VelocityTimeRatio, and VelocityDistanceRatio to fully control how inertia scrolling looks and feels.
In the screenshot above, you can see how our main Sample Browser pages have been updated with InertiaScrollViewer, allowing full touch interaction and navigation within them.

