First Look at Charts - Financial Dashboard Demo

by Avatar Bill Henning (Actipro)
Thursday, March 14, 2013 at 4:26pm

BlogPostBanner

We've just about wrapped everything up for the 2013.1 versions of our WPF, Silverlight, and WinRT/XAML controls and hope to have them out next week.

As mentioned in a previous post, this new version introduces a new full-size Charts product to complement our existing Micro Charts controls product.

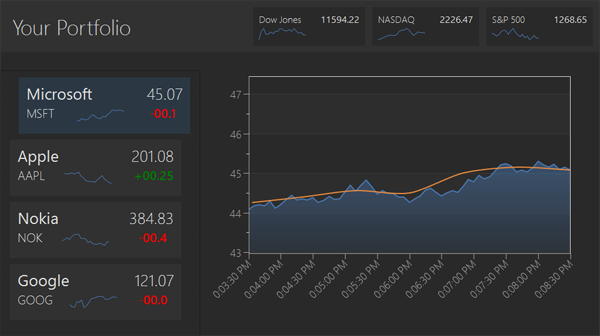
In this post I'd like to show a screenshot of one of the demos that comes with Charts:

Financial

This demo shows a simulated financial dashboard where the charted values refresh and scroll every few seconds.  You can click on a stock on the left side to view its detail in the large chart on the right.

The new Charts product, this sample, and many more QuickStarts are coming soon in the 2013.1 version!

SyntaxEditor - Debugging Indicators

by Avatar Bill Henning (Actipro)
Wednesday, March 13, 2013 at 1:42pm

BlogPostBanner

Last week we blogged about how indicators are coming to the WPF and Silverlight SyntaxEditor controls in their 2013.1 versions.  Indicators are special "tagged" regions of text that optionally display a glyph in the indicator margin or highlight the text range with special styles.

In that previous post, we showed off bookmark indicators.  Today, I'd like to show off the other two built-in kinds:  breakpoints and current statement indicators.

Visual Debugging

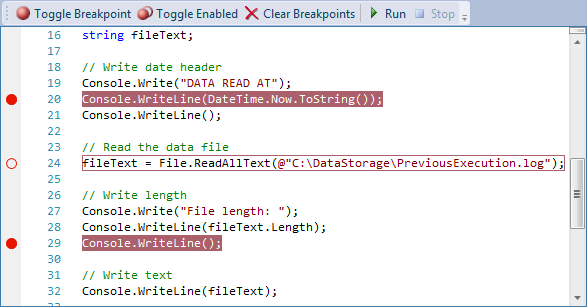
A new QuickStart we are adding is a simulated debugging experience.  It allows you to set breakpoint indicators on various C# lines and then enter a debugger break state when executing the code.

Debugging1

You can see how three breakpoint indicators have been added.  Our implementation of breakpoint indicators includes an IsEnabled property.  When set to false, the indicator renders differently to reflect its disabled state.

Breakpoints in this sample can be added via the Toggle Breakpoint toolbar button.  Or alternatively, you can click the indicator margin (where the glyphs appear) to toggle a breakpoint.  We include the full source code for showing how to interact with that margin by intercepting mouse events.

Let's click the Run button.

Debugging2

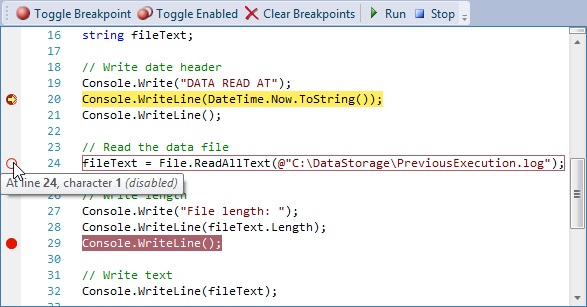
The first breakpoint is located and we set a current statement indicator.  This kind of indicator uses a yellow arrow glyph and renders the background of its contained text in yellow.  It is set up to be higher in z-order than breakpoints.

This screenshot also shows how content providers for quick info can be set up for when the mouse hovers over a glyph.  The displayed quick info content can be generated on-demand.

Let's click the Run button again.

Debugging3

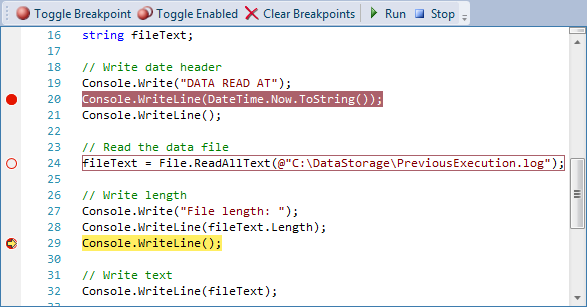
The current statement indicator uses the built-in indicator search API to locate the next enabled breakpoint.  It skips over the one in the middle that is disabled and lands on the third breakpoint.

Summary

Although the debugging experience here is simulated, by hooking up these indicator features to a debugger for your language, you can easily implement a full debugging UI for your code editor.

These new features and sample will be in the 2013.1 version.

TaskDownload TaskLiveDemo TaskBuyNow

WPF and Silverlight Sample Browsers Redesigned

by Avatar Bill Henning (Actipro)
Friday, March 8, 2013 at 8:52am

BlogPostBanner

With the 2013.1 versions of our WPF and Silverlight controls coming soon, I'd like to take this time to showcase the major redesign we just did to our Sample Browser applications in both platforms.

The Sample Browser is the main project that houses the hundreds of demos and QuickStarts for our many UI control products.  While the current Sample Browser design is functional, it was built several years back and needed a refresh.  We wanted to simplify things a bit and bring more of a modern UI feel to it.

Let's take a look at the result!

Product Selection
SampleBrowser1

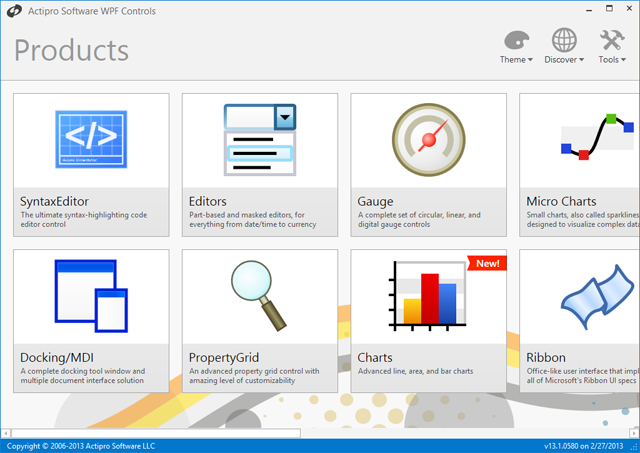
When first starting the Sample Browser, you are brought to a Product Selection page.  Scroll horizontally to see the various control product sets we offer.  Click on a product to dive into it.  Let's click the Micro Charts product.

Product Feature Summary
SampleBrowser2

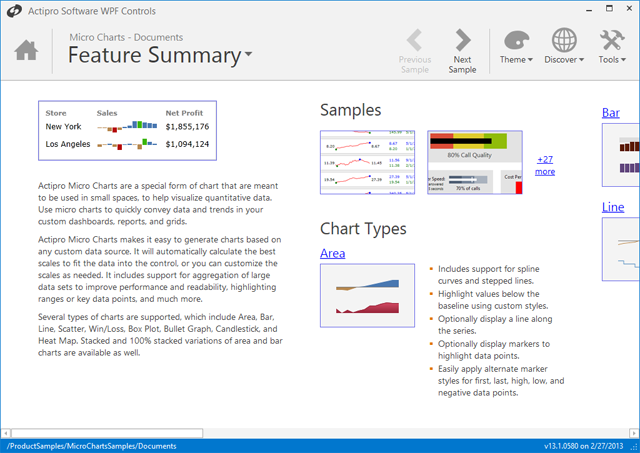
The Micro Charts' Feature Summary page appears.  It has a brief overview of the product and numerous screenshot links that take you directly into the samples.  By scrolling right, we can continue to learn more about the product with bullet lists of features.

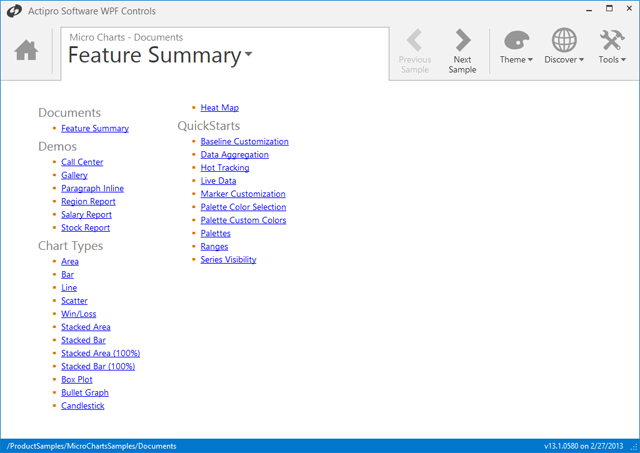
Note how the Samples section tells us that there are 29 total samples available.  By clicking the Feature Summary drop-down heading at the top, a backstage-like pane appears that lists the titles of all the samples.  Click any of the sample title hyperlinks there to jump directly to the related sample.
SampleBrowser2b

Let's click the Call Center demo link.

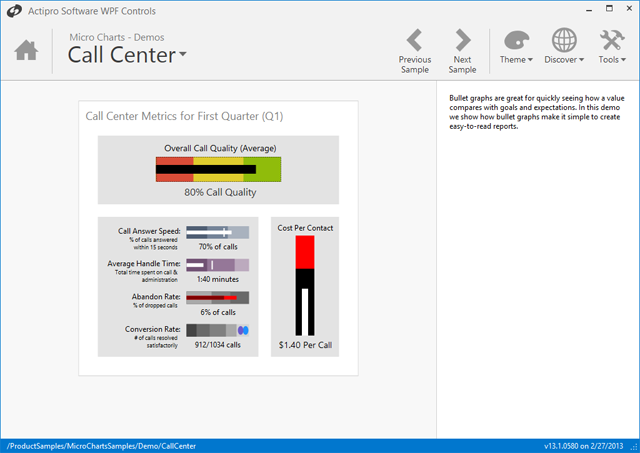
Product Sample
SampleBrowser3

We now have moved directly into the related sample.  In this case, it's the Call Center demo for Micro Charts.

It's easy to browse through samples.  The Previous Sample and Next Sample buttons at the top cycle through the samples for this product.  Or as mentioned before, you can click the large heading drop-down (that currently reads Call Center in this screenshot) to see a list of links for all the samples.

Clicking the Home icon on the upper left returns us to the Product Selection page.

Other Options

The three drop-down buttons on the upper right are important too and can be used from anywhere in the app.

The Theme drop-down lets you change the current theme.  Choose from our various system, Office, or Metro themes.  And the entire app window will update immediately.  Note how the root window here is using our WindowChrome class to provide custom chrome.

The Discover drop-down provides access to various Actipro-related web sites.

The Tools drop-down gives access to documentation, several utilities (like our String Resource Browser), the Release History documents, and more.

Summary

We've put a lot of extensive work into the redesign of our Sample Browser app.  We really hope you enjoy the new modern look when you get your hands on it, upon the release of the 2013.1 version.

SyntaxEditor - Bookmark Indicators

by Avatar Bill Henning (Actipro) - 2 comments
Thursday, March 7, 2013 at 1:40pm

BlogPostBanner

One of the feature areas we're adding to WPF and Silverlight SyntaxEditor controls is the ability to create indicators, which are special "tagged" regions of text that optionally display a glyph in the indicator margin or highlight the text range with special styles.

Several built-in indicator types will come with SyntaxEditor, one of them being bookmarks.

Bookmark Indicators

Bookmarks are line-based indicators, meaning they associate themselves with a single line of text.  Even as the line gets edited, they remain associated with a single full line.  They move around with the same logic found in Visual Studio's code editor.

Let's see what they look like:

Bookmarks

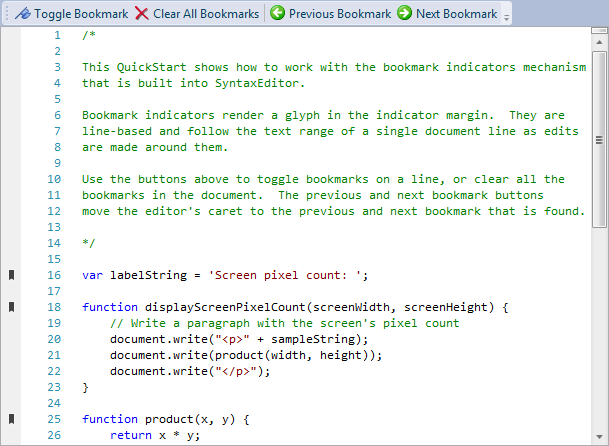
In this screenshot, we show three bookmarks rendered in the indicator margin on the left.  Our default implementation of bookmarks only renders glyphs in the margin, and doesn't highlight the marked line in the text area in any way (but you could optionally do this too if you wanted).

The toggle bookmark button checks to see if a bookmark is already on the caret's line.  If there is one, it removes it.  If there isn't one, it adds a new bookmark.  Clear all bookmarks removes them all from the document.

The previous and next bookmark buttons use our indicator search API to find another indicator based on an initial line.  In this case, we pass in the line that contains the caret and find the previous/next indicator.  If one is found, we move the caret to that line.

Summary

These features will be in the 2013.1 versions of the WPF and Silverlight SyntaxEditor controls.

We are still working on the design and implementation of indicators.  If you have any feature suggestions, now is the time to contact us!  Please comment here or e-mail us with your ideas and questions.

TaskDownload TaskLiveDemo TaskBuyNow

Announcing Our Upcoming Charts Products

by Avatar Bill Henning (Actipro) - 4 comments
Wednesday, March 6, 2013 at 12:08pm

BlogPostBanner

As we finally draw near the release of the 2013.1 versions of our WPF, Silverlight, and WinRT/XAML controls, I'd like to take this opportunity to announce a new product being added to all three platforms:  full size charts!

The platforms mentioned above already have our Micro Charts product, which is ideal for visualizing data in small sizes, such as in grids or dashboards.  Customers have asked for complementary large charts that have multiple-axis support, grid lines, etc.  And we have delivered.  The 2013.1 versions will be receiving full size charts, and as usual, the API will be the same among the three platforms, allowing you to easily port code around.

First Look

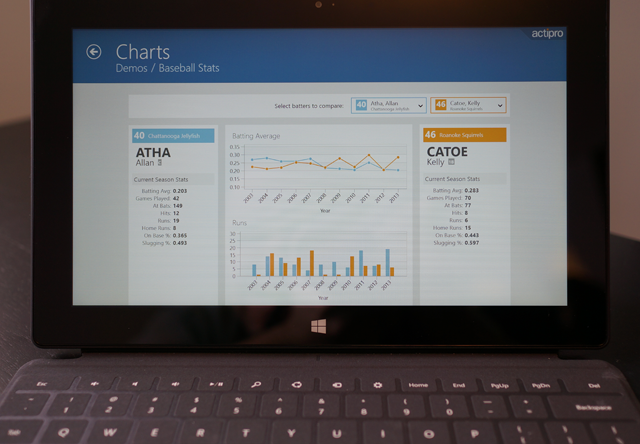
Let's take a first look at a Surface device running the WinRT version of a Charts demo:

ChartsTeaser

In this Baseball Stats sample, we compare the statistics of two fictional baseball players and visualize important data through the use of charts.

Summary

We are currently finishing up the 2013.1 versions for the platforms and hope to have them (and the new Charts products) out in the next couple weeks or so.  Keep watching our blog for more details.